

Sustainability

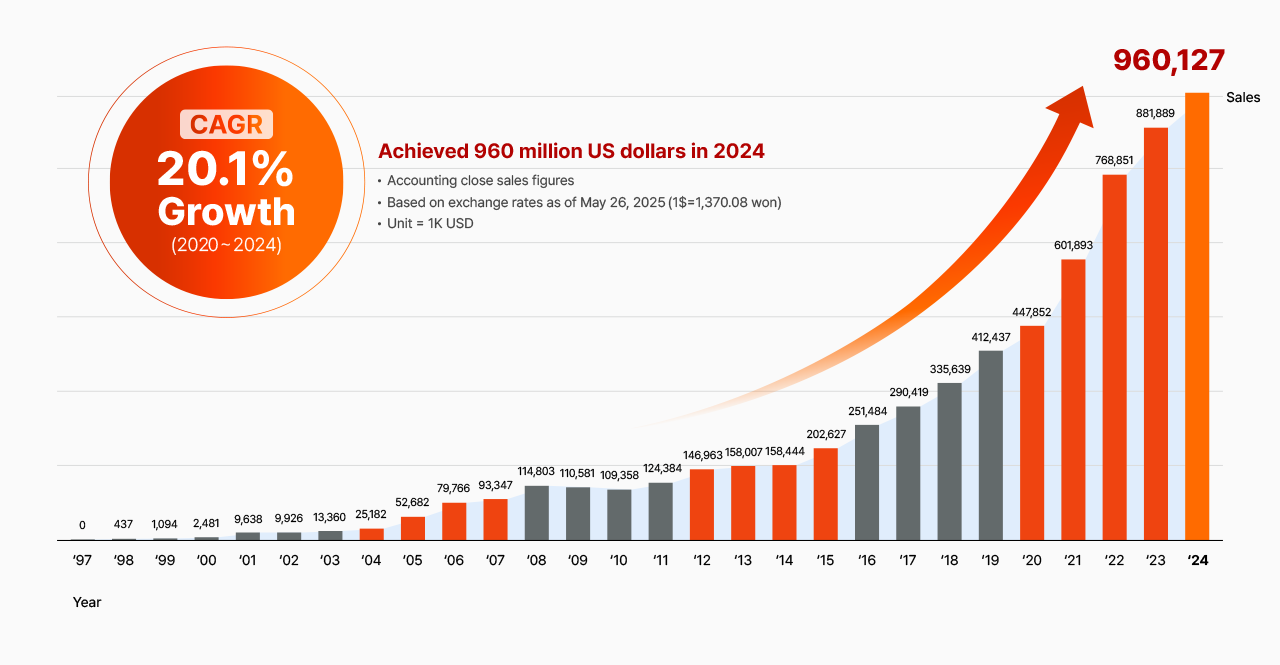
Osstem Implant, Korea's leading implant specialist, reached a significant
milestone by achieving sales of 1 trillion KRW in 2022, becoming the first domestic dental implant company
to do so. This accomplishment highlights our stable and balanced growth both in Korea and internationally.
We are evolving into a 'Total Solution' provider, offering comprehensive dental solutions, including implants and digital dentistry. Through ongoing research and development, technological innovation, and efficient operations, we plan to establish 50 overseas subsidiaries across 46 countries by 2026.
This expansion aims to solidify our global sales network, increase the share of overseas sales to 70%, and continue our journey towards becoming the world's leading dental company.
ESG Integrated Report
Growth trend
Financial Information
Performance (past 4 years)
- Operating profit

- Sales revenue

- Total assets

Summary of financial statementsUnit: KRW 1 million
| Sort | Rd. 23 | Rd. 24 | Rd. 25 | Rd. 26 |
|---|---|---|---|---|
| 2019 | 2020 | 2021 | 2022 | |
| Sales revenue | 566,043 | 631,596 | 824,566 | 1,053,472 |
| Operating profit | 42,901 | 98,098 | 143,331 | 234,569 |
| Profit Before Tax (PBT) | 29,330 | 103,059 | 34,988 | 202,238 |
| Consolidated net income | -21,960 | 103,534 | 23,411 | 144,201 |
Summary of consolidated statement of financial positionUnit: KRW 1
million
| Sort | Rd. 23 | Rd. 24 | Rd. 25 | Rd. 26 |
|---|---|---|---|---|
| 2019 | 2020 | 2021 | 2022 | |
| Current assets | 397,023 | 504,825 | 612,126 | 687,518 |
| Non-current assets | 400,366 | 453,846 | 539,714 | 684,803 |
| I. Total assets | 797,390 | 958,671 | 1,151,841 | 1,372,321 |
| Current liabilities | 531,561 | 551,819 | 877,245 | 919,036 |
| Non-current liabilities | 183,488 | 218,352 | 58,139 | 90,740 |
| II. Total liabilities | 715,049 | 770,171 | 935,384 | 1,009,776 |
| Ownership stake of the parent company |
80,030 | 191,664 | 207,150 | 343,158 |
| Capital | 7,143 | 7,143 | 7,143 | 7,452 |
| Retained earnings | 65,748 | 173,172 | 187,674 | 328,428 |
| Non-controlling interest | 2,311 | -3,164 | 9,308 | 19,387 |
| III. Total equity | 82,341 | 188,500 | 216,457 | 698,425 |
3, Magokjungang 12-ro, Gangseo-gu, Seoul, Korea
TEL: +353 (0) 863066660 FAX:
+82-2-2016-7001
COPYRIGHT © OSSTEM IMPLANT CO., LTD. ALL RIGHTS RESERVED.
 Consensus Report
 Virtual Tour (360°
VR)
 TOP